Data
analysis and visualization skills
In this section, I put some of my R, SQL and Java code that I have used in various classes at
George Mason University.
R programming:
Quality
Management (OSCM 456)
library(ggplot2)
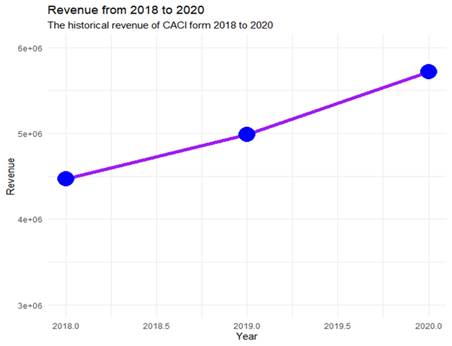
CACI_rev
<- data.frame (Year = c(2018, 2019, 2020), Revenue
= c(4467860, 4986341, 5720042))
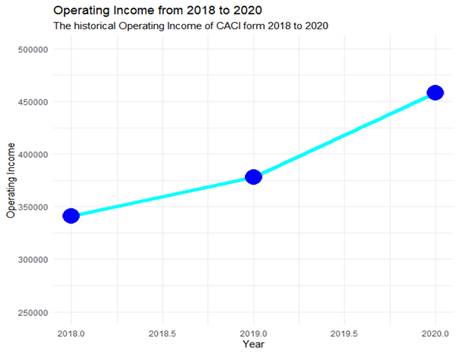
CACI_op_income <- df <- data.frame (Year =
c(2018, 2019, 2020), Income_from_operations =
c(340700, 377867, 457696))
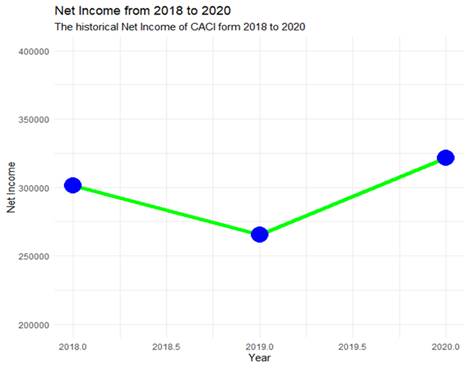
CACI_income
<- df <- data.frame (Year = c(2018, 2019,
2020), Net_Income = c(301171, 265604, 321480))
ggplot(
CACI_rev, aes(
x
= Year, y = Revenue)) + geom_line(col =
"purple", size = 2) + geom_point(col =
"blue", size = 8) + ylim(3000000, 6000000)
+ labs(title = "Revenue from 2018 to 2020", y = "Revenue",
subtitle = "The historical revenue of CACI form
2018 to 2020") + theme_minimal()
ggplot(
CACI_op_income, aes(
x
= Year, y = Income_from_operations)) + geom_line(col = "cyan", size = 2) + geom_point(col = "blue", size = 8) + ylim(250000, 500000) + labs(title = "Operating Income
from 2018 to 2020", y ="Operating Income", subtitle = "The
historical Operating Income of CACI form 2018 to
2020") + theme_minimal()
ggplot(
CACI_income, aes(
x
= Year, y = Net_Income)) + geom_line(col
= "green", size = 2) + geom_point(col
="blue", size = 8) + ylim(200000, 400000) +
labs(title = "Net Income from 2018 to 2020", y = "Net
Income", subtitle = "The historical Net Income of CACI form 2018 to 2020") + theme_minimal()
Plotting:
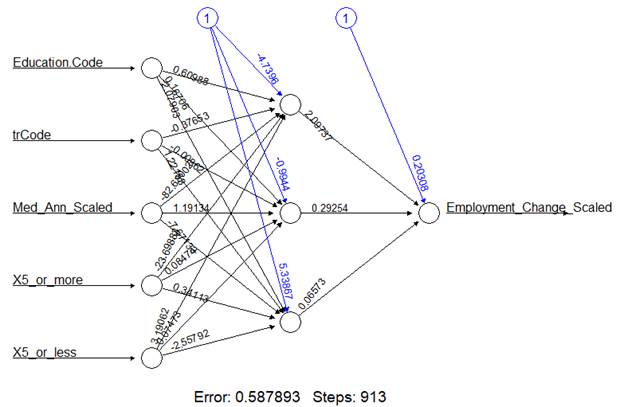
Neural Networks in R:
Advanced Data Mining (MIS 432)
library(neuralnet)
employment_df
<- read.csv("Project_pre_processed.csv", header = TRUE)
#Review the dataset
View(employment_df)
#The dataset includes the observation value, delete it
employment_df
<- employment_df[, -1]
#The employment change will be the variable that we
want to predict using the data
#Divide the dataset into training and validation
set.seed(1)
train_rows_e
<- sample(rownames(employment_df),
dim(employment_df)[1]*0.6)
train_data_e
<- employment_df[train_rows_e,
]
valid_rows_e
<- setdiff(rownames(employment_df), train_rows_e)
valid_data_e
<- employment_df[valid_rows_e,
]
#Create the model
set.seed(1)
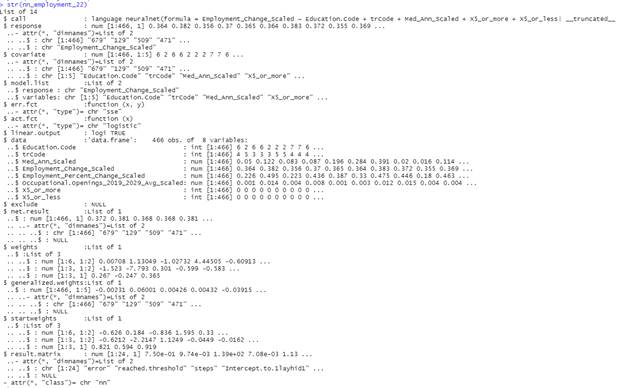
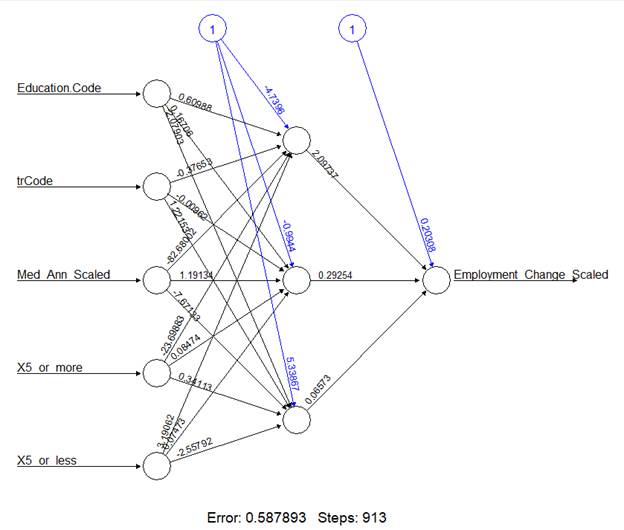
nn_employment_22 <- neuralnet(Employment_Change_Scaled ~
Education.Code + trCode + Med_Ann_Scaled + X5_or_more + X5_or_less, data = train_data_e, linear.output =
TRUE, hidden = c(2, 2))
plot(nn_employment_22)
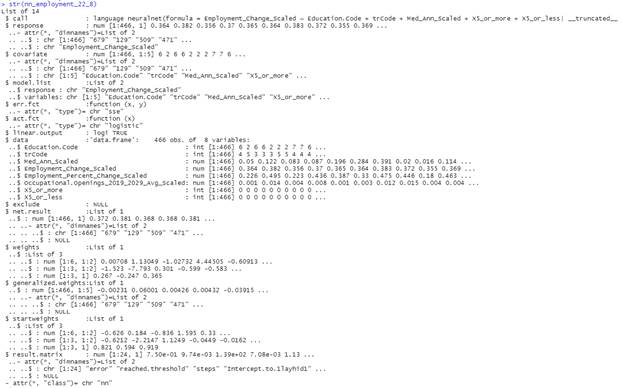
str(nn_employment_22)
#Responses are numeric, use MSE
#First, predict the results for the model
nn_22_pred <- predict(nn_employment_22, valid_data_e[, c(1, 2, 3, 7, 8)])
(MSE_nn_22 <- sum((valid_data_e$Employment_Change_Scaled
- nn_22_pred)^ 2)/ nrow(valid_data_e))
![]()
#Really large datasets may make the computation time
to be longer, not the case
#Test theory of partition, try an 80/20 partition
instead
set.seed(1)
train_rows_e8 <- sample(rownames(employment_df), dim(employment_df)[1]*0.8)
train_data_e8 <- employment_df[train_rows_e, ]
valid_rows_e8 <- setdiff(rownames(employment_df), train_rows_e)
valid_data_e8 <- employment_df[valid_rows_e, ]
#Do the other neural networks
set.seed(1)
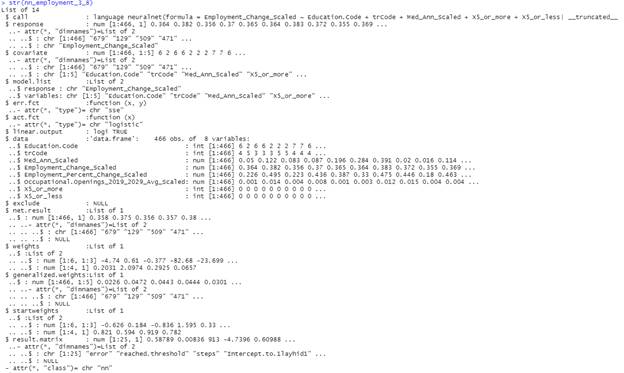
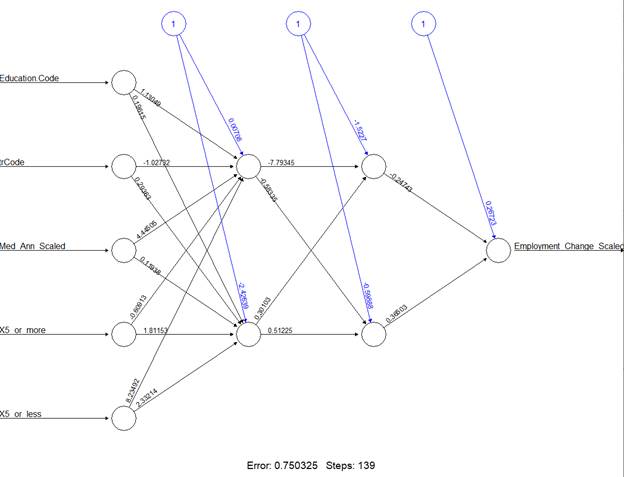
nn_employment_3_8 <- neuralnet(Employment_Change_Scaled ~
Education.Code
+ trCode + Med_Ann_Scaled +
X5_or_more + X5_or_less, data = train_data_e8, linear.output
= TRUE, hidden = 3)
plot(nn_employment_3_8)
str(nn_employment_3_8)
set.seed(1)
nn_employment_22_8 <- neuralnet(Employment_Change_Scaled ~
Education.Code + trCode + Med_Ann_Scaled + X5_or_more + X5_or_less, data =
train_data_e8, linear.output = TRUE, hidden = c(2,
2))
plot(nn_employment_22_8)
str(nn_employment_22_8)
K-means clustering using the tidyverse:
Advanced Data Mining (MIS 432)
#Based on
https://www.tidymodels.org/learn/statistics/k-means/
#A tidy approach to K means clustering
library(tidyverse)
library(tidymodels)
#Convert the data frame into a tibble
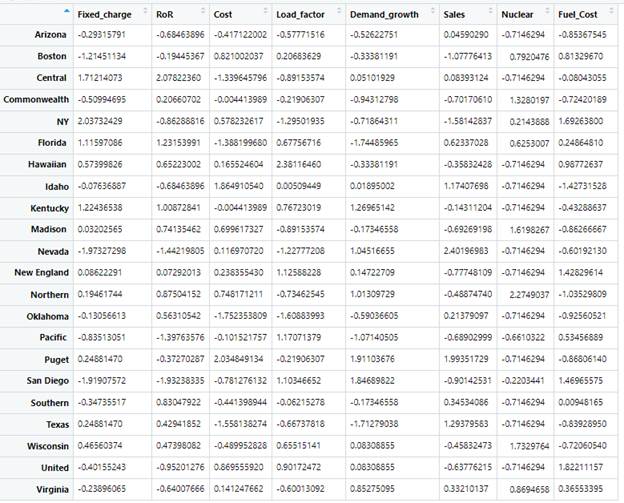
utilities_df
<- read.csv("Utilities.csv", header = TRUE)
#Apply all the transformations
uti_tibble_norm
<- as_tibble(utilities_df)
%>% column_to_rownames(var = "Company")
%>% modify(scale)
View(uti_tibble_norm)
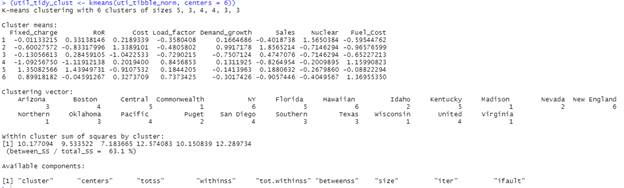
set.seed(5)
(util_tidy_clust <- kmeans(uti_tibble_norm, centers =
6))
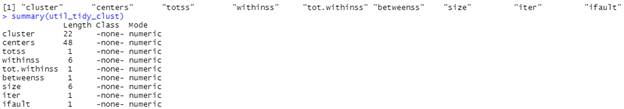
#Let's explore the model
first with summary
summary(util_tidy_clust)
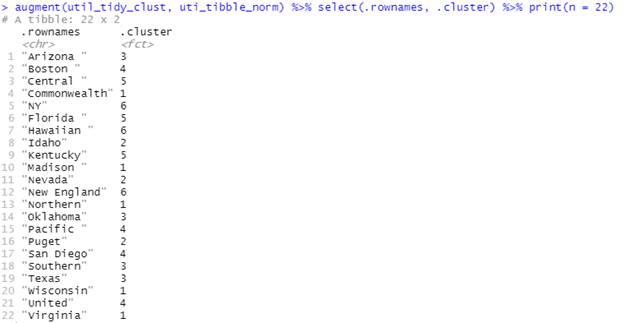
#We can see the cluster classification with augment
from tune
augment(util_tidy_clust, uti_tibble_norm) %>% select(.rownames,
.cluster) %>% print(n = 22)
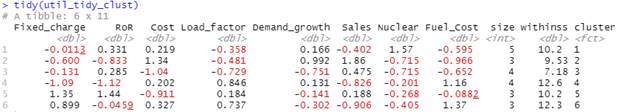
#Tidy will summarize by cluster
tidy(util_tidy_clust)
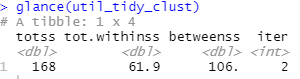
#Glance gives us access to a single-row summary
glance(util_tidy_clust)
SQL code:
Data Warehousing (MIS 430)
/* Fact Tables */
CREATE TABLE [Avg_Price Fact Table] (
[LocationKey] int
NOT NULL,
[CalendarKey] int
NOT NULL,
[VolumeKey] int
NOT NULL,
[CompanyKey] int NOT NULL,
[ClosingPrice]
float NOT NULL,
[OpeningPrice] float NOT
NULL,
[Average_Price] float NOT
NULL
PRIMARY KEY(LocationKey, CalendarKey, VolumeKey,
CompanyKey)
)
CREATE TABLE [Avg_Volume Fact Table] (
[CalendarKey] int
NOT NULL,
[CompanyKey] int NOT NULL,
[VolumeKey] int
NOT NULL,
[VolumePrice]
float NOT NULL
)
/*Dimensions*/
CREATE TABLE [Volume
Dimension] (
[VolumeKey] int
NOT NULL PRIMARY KEY,
[VolumeCategory]
char,
[DatasetKey] int
NOT NULL,
)
CREATE TABLE [Company
Dimension] (
[CompanyKey] int NOT NULL PRIMARY KEY,
[CompanySectorName]
char NOT NULL,
[CompanyName] char NOT NULL,
[CompanySymbol]
char NOT NULL
)
CREATE TABLE [Location
Dimension] (
[LocationKey] int
NOT NULL PRIMARY KEY,
[State] char,
[City] char,
[Street] char,
[Zip] char
)
CREATE TABLE [Calendar
Dimension] (
[CalendarKey] int
NOT NULL PRIMARY KEY,
[FullDate] date,
[Year] int,
[Month] char,
[Quarter] char,
[DayofWeek] char
)
Java Programming:
Programming for Business (MIS 350)
1 import java.awt.*;
2 import java.awt.event.*;
3 import javax.swing.*;
4 public class ECTechRepair extends JFrame
implements ActionListener {
5 JPanel
panel;
6 JLabel
user_label, password_label,
message;
7 JTextField
userName_text;
8 JPasswordField
password_text;
9 JButton
submit, cancel;
10 ECTechRepair(){
11 //This is
the Username Label
12 user_label = new JLabel();
13 user_label.setText("Employee ID");
14 user_label.setOpaque(true);
15 user_label.setBackground(Color.YELLOW);
16 Font font = new Font("Times New Roman", Font.BOLD, 25);
17 user_label.setFont(font);
18 userName_text =
new JTextField();
19 //Label for
the Password
20 password_label
= new JLabel();
21 password_label.setText("Employee Password :");
22 password_label.setOpaque(true);
23 password_label.setBackground(Color.YELLOW);
24 password_text =
new JPasswordField();
25 password_label.setFont(font);
26 //Enter
27 submit = new JButton("Enter
Credentials");
28 submit.setBackground(Color.CYAN);
29 panel = new JPanel(new GridLayout(3, 2));
30 panel.setBackground(Color.CYAN);
31 panel.add(user_label);
32 panel.add(userName_text);
33 panel.add(password_label);
34 panel.add(password_text);
35 message = new JLabel();
36 panel.add(message);
37 panel.add(submit);
38 setDefaultCloseOperation(JFrame.EXIT_ON_CLOSE);
39 //Add the
listeners to the components
40 submit.addActionListener(this);
41 add(panel, BorderLayout.CENTER);
42 setTitle("ECTechRepair
Unique Login");
43 setSize(600,325);
44 setVisible(true);
45 }
46 public static void main(String[] args){
47 new ECTechRepair();
48 }
49 public void actionPerformed(ActionEvent ae){
50 String EmployeeID
= userName_text.getText();
51 String password = password_text.getText();
52 Font font = new Font("Times New Roman", Font.BOLD, 35);
53 if (EmployeeID.trim().equals("143") && password.trim().equals("Demo")) {
54 message.setText("
Hello Fariha");
55 message.setFont(font);
56 message.setForeground(Color.BLUE);
57 } else {
58 message.setText("Invalid credentials");
59 message.setFont(font);
60 message.setForeground(Color.RED);
61 JOptionPane.showMessageDialog(null, "Try again");
62 }
63 }
64 }